For a collection of distributions, obtain the distributions of the
maximum (maximize()) and minimum (minimize()) from independent draws of
each component distribution.
Aliases maximise() and minimise() are also provided.
Arguments
- ...
Distribution objects, or list of distributions.
- draws
Number of draws from each distribution considered in the maximum (possibly not integer, but never negative). Either a single numeric applying to all distributions in
..., or a vector matching the number of distributions in....- na_action_dst, na_action_draws
What should be done with Null distributions in
...andNAindraws? Character vector of length 1: one of "fail", "null" (default), or "drop". See details.
Details
To give an example of what distribution is returned, if X1 and X2 are
two random variables with distributions D1 and D2 respectively, then
maximize(D1, D2, draws = c(2, 3)) returns the distribution of
max(X1, X1, X2, X2, X2).
Distributions in ... and the draws vector are recycled to have the
same length, but only if one of them has length 1
(via vctrs::vec_recycle_common()).
na_action_dst and na_action_draws specify the NA action for distributions
and draws. "NA" here means either NA in the draws vector, or
a Null distribution (distionary::dst_null()) in the distributions.
Options are, in order of precedence:
"fail": Throw an error in the presence of NAs."null": Return a Null distribution in the presence of NAs."drop": Remove distribution-weight pairs having an NA value
Simplifications made in these functions include the following:
If any distributions are entirely to the left (right) of others, then they are removed from consideration in
maximize()(minimize()).If all Finite distributions are input, the result is also a Finite distribution.
If the same distribution is input multiple times, their corresponding draws are summed.
Examples
library(distionary)
# One is always more extreme than the other in this case.
d1 <- dst_unif(-1, 2)
d2 <- dst_unif(5, 6)
maximize(d1, d2) # d2
#> Uniform distribution (continuous)
#> --Parameters--
#> min max
#> 5 6
minimize(d1, d2) # d1
#> Uniform distribution (continuous)
#> --Parameters--
#> min max
#> -1 2
# Visualizing the maximum and minimum
d3 <- dst_norm(4, 1)
d4 <- dst_exp(0.3)
dmax <- maximize(d3, d4, draws = 1:2)
dmin <- minimize(d3, d4, draws = 1:2)
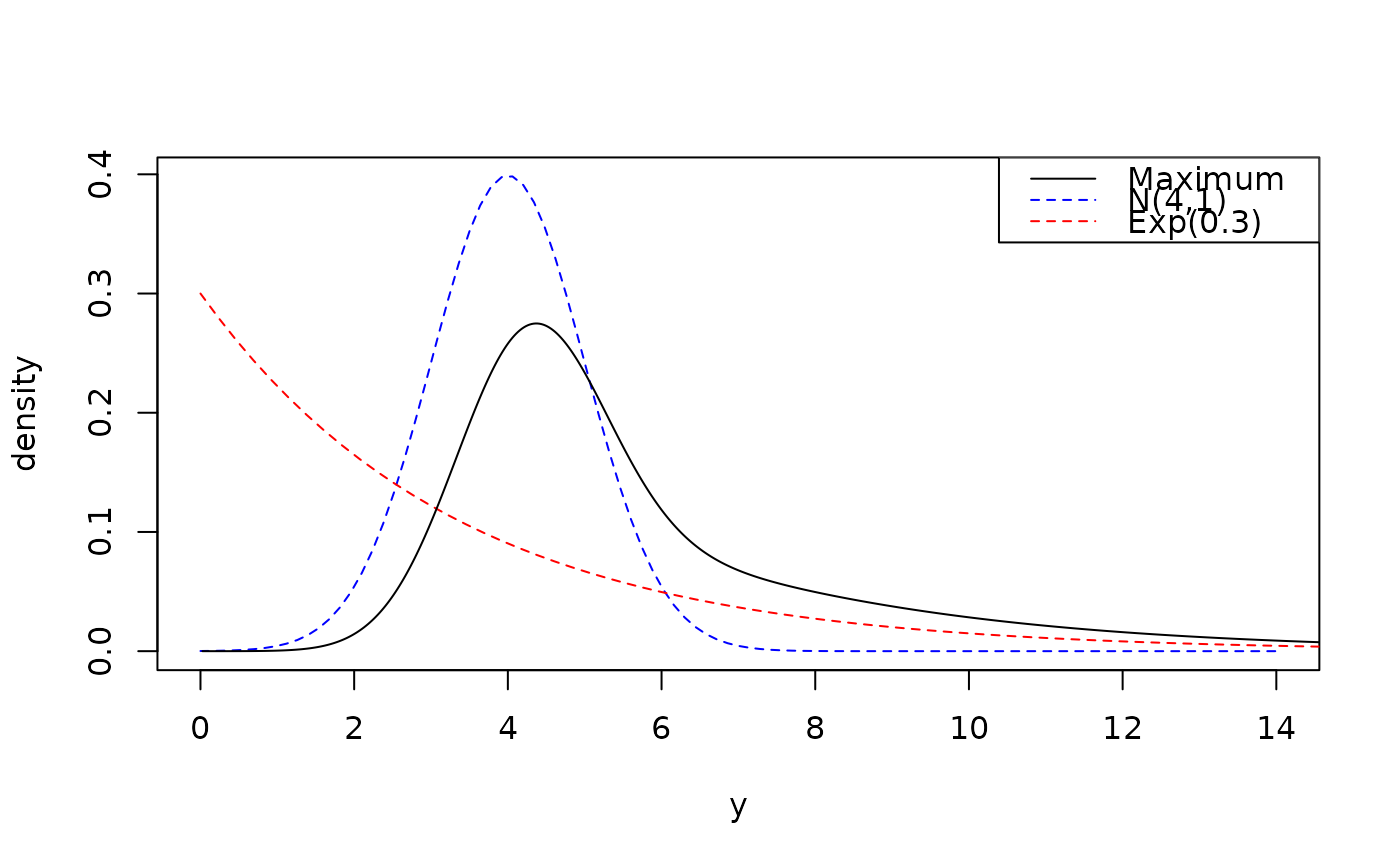
# Maximum
plot(d3, col = "blue", lty = 2, from = 0, to = 14)
plot(d4, col = "red", lty = 2, add = TRUE)
plot(dmax, add = TRUE, n = 1000)
legend(
"topright",
legend = c("Maximum", "N(4,1)", "Exp(0.3)"),
col = c("black", "blue", "red"),
lty = c(1, 2, 2)
)
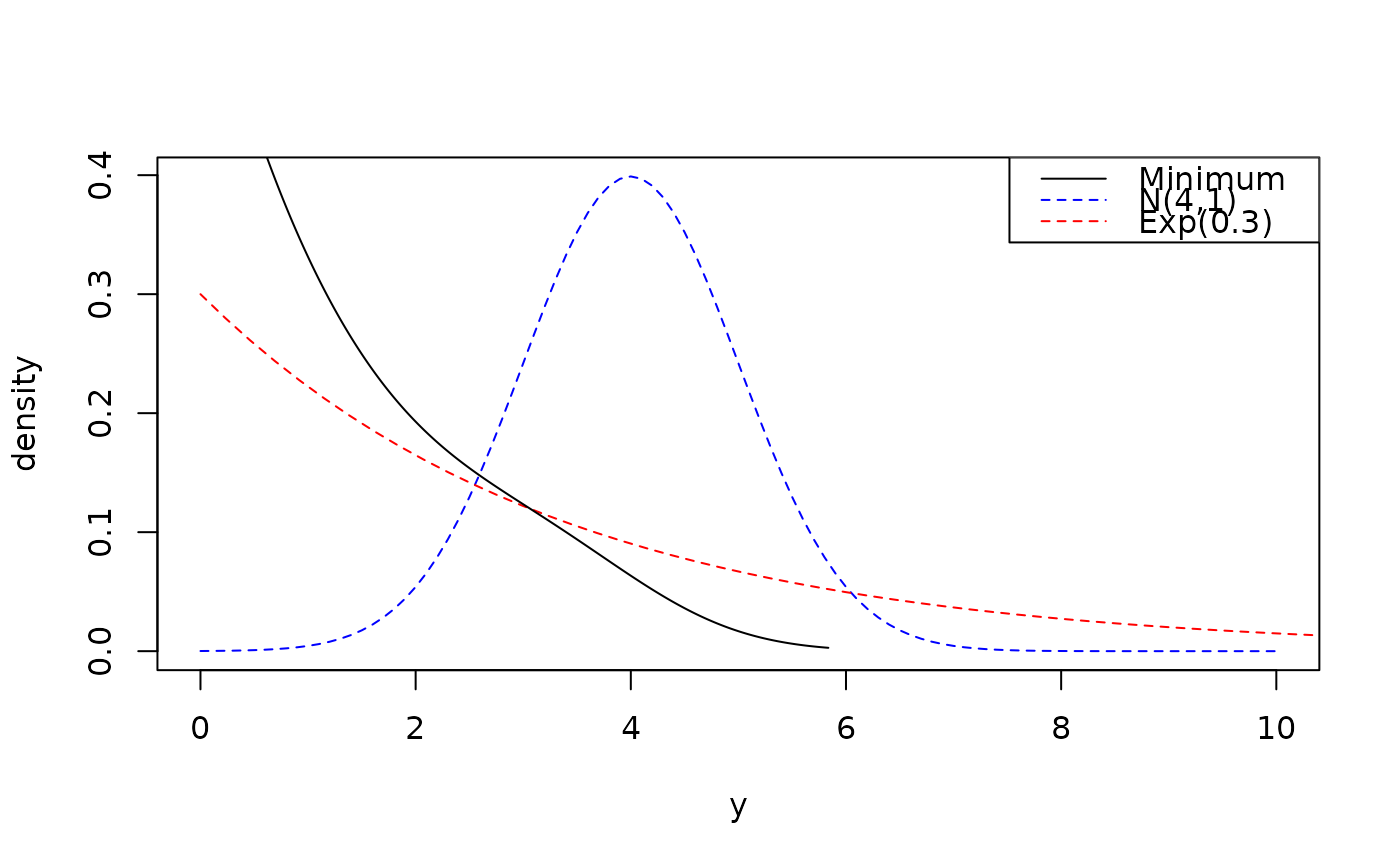
 # Minimum
plot(d3, col = "blue", lty = 2, from = 0, to = 10)
plot(d4, col = "red", lty = 2, add = TRUE)
plot(dmin, add = TRUE, n = 1000)
legend(
"topright",
legend = c("Minimum", "N(4,1)", "Exp(0.3)"),
col = c("black", "blue", "red"),
lty = c(1, 2, 2)
)
# Minimum
plot(d3, col = "blue", lty = 2, from = 0, to = 10)
plot(d4, col = "red", lty = 2, add = TRUE)
plot(dmin, add = TRUE, n = 1000)
legend(
"topright",
legend = c("Minimum", "N(4,1)", "Exp(0.3)"),
col = c("black", "blue", "red"),
lty = c(1, 2, 2)
)